Shape Descriptors & Geodesic Distance & Sampling
Geometry & mesh processing is an interesting field in computer graphics which I was very curious about previously. Hopefully by a wonderful course offered by Assoc. Prof. Yusuf Sahillioğlu during my Ph.D studies, I found a nice opportunity to get my hands dirty. I initially started experimenting with geodesic distances and shape descriptors on meshes.
Firstly, geodesic distance on a mesh is represented as shortest path between two mesh vertices that is on surface. In that case considering a mesh is a planar graph, as you may have guessed,Dijkstra’s shortest path algorithm successfully obtains geodesic distance between two graph vertices. Performance wise, in order to optimize Dijkstra algorithm a priority queue or Fibonacci heap(which I have used in my case) could be useful to speed-up the algorithm. In a typical mesh processing scenario, all-pair shortest paths between all vertices in a mesh is needed therefore Dijkstra’s algorithm could be time consuming as the number of vertices in the mesh increases. Luckily, all-pair shortest path problem is embarrassingly parallel.

Figure-1: Geodesic distance between two points on a mesh, Note that blue is source vertex and yellow is destination vertex.
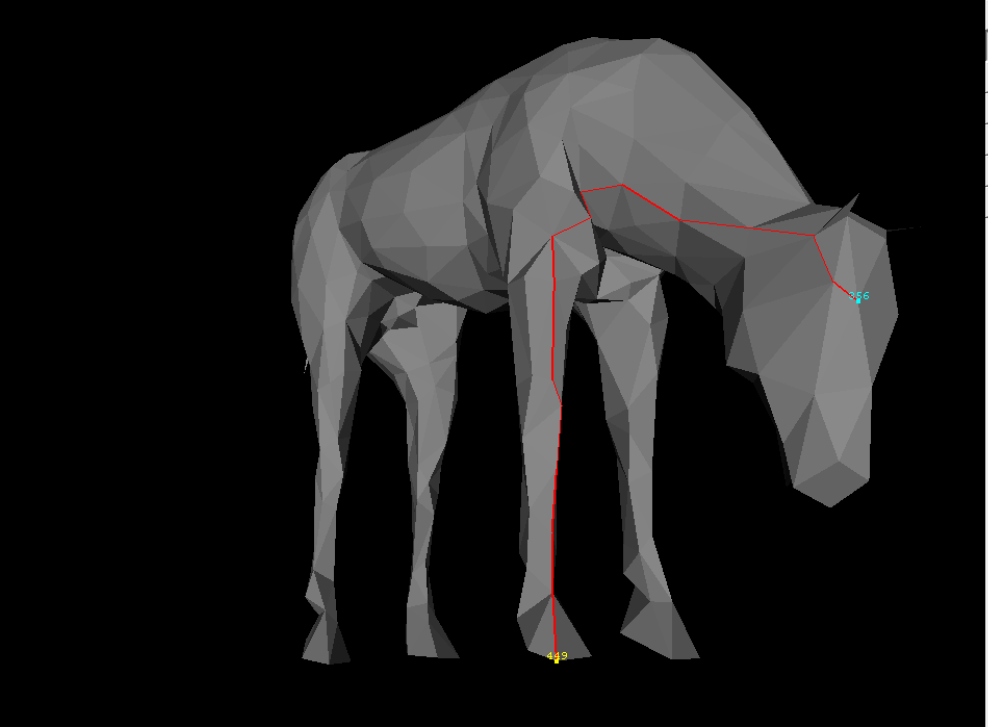
Figure-2: Geodesic distance between two points on a mesh, Note that blue is source vertex and yellow is destination vertex.
While experimenting geodesic distance, I’ve tried to find characteristic vertices of mesh models like head of the man and horse in Figure-1, Figure-2 above. For this purpose I’ve used a simple algorithm as illustrated below:
-- Create an empty characteristic vertices set
-- Select a currentVertex, any random vertex in mesh initially
-- Until sampleCount number of vertices are selected as characteristic
   vertex do following:
    -- For each vertex in mesh do following:
        -- If vertex is not in characteristic vertex list
            -- Find cumulative distance of this vertex to all other vertices
               in characteristic vertex list
            -- If this vertex maximizes previously remembered maximum distance to
               characteristic vertex list add it to characteristic vertex list
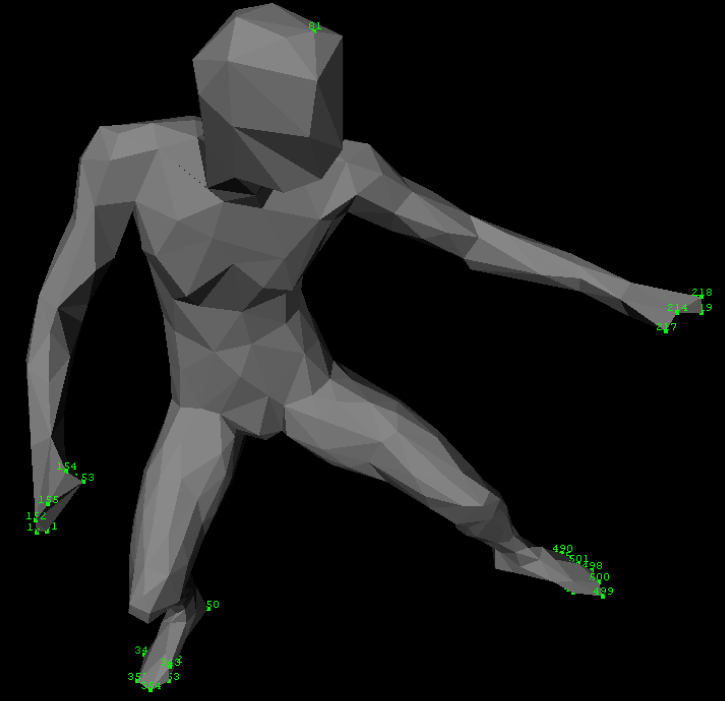
Figure-3: Sampling characteristic vertices of mesh.
As its name suggests “Shape Descriptors” are used on meshes to represent them automatically and discriminatively. Desired properties of a shape descriptor in mesh processing can be stated as follows:
- Should be fast to compute and compare.
- Should be invariant to rigid and non-rigid transformations.
In this respect, I have implemented a shape descriptor named as “Bilateral Maps”[1] and “Geodesic Iso-Curve Signature”[2]. Briefly a geodesic iso-curve is defined by combination of arc segments that are t distance away from seed vertex. From a seed vertex, geodesic iso-curve signature is defined as lengths of geodesic iso-curves that are [t, 2t, 3t … , Max Distance] away from seed vertex. Note that, “Max Distance” is maximum of all distances from source vertex to all other vertices in mesh.
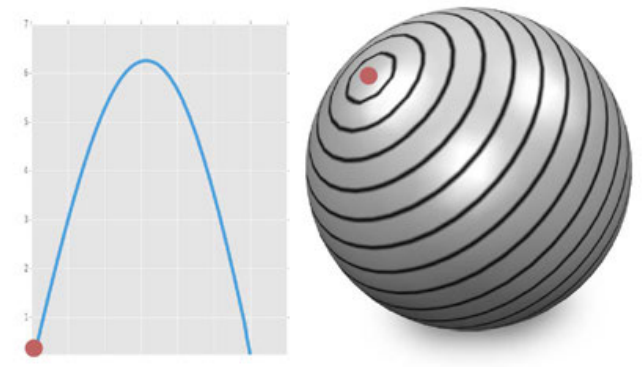
Figure-4: Geodesic iso-curve visualization of a sphere and its associated geodesic iso-curve signature [2]. Note that, red is seed vertex.
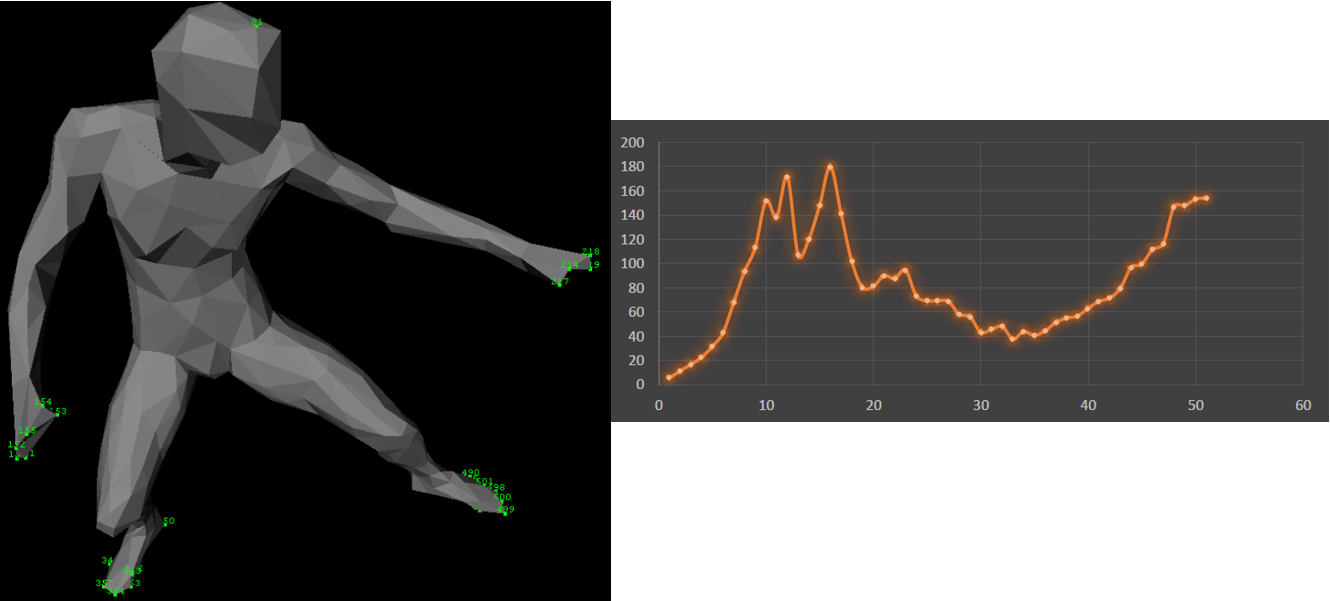
Figure-5: Geodesic iso-curve signature results for human model. Note that geodesic iso-curve signature is constructed from head vertex(81). X axis denotes number of geodesic iso-curves Y axis denotes length of geodesic iso-curves
My implementation results for geodesic iso-curve signature descriptor is stated in Figure-5 above.
Bilateral Map shape descriptor is constructed as follows, from a starting vertex p towards a destination vertex q, triangles that are within \({\theta}\) distance from shortest path from p to q are selected as region of interest ROI. Then according to the distances from p triangles that are in ROI divided into equally sized bins. A metric in each bin (e.g. total triangle area) provides us a shape descriptor as illustrated in Figure-6 below. My results for bilateral maps is illustrated in Figure-7.
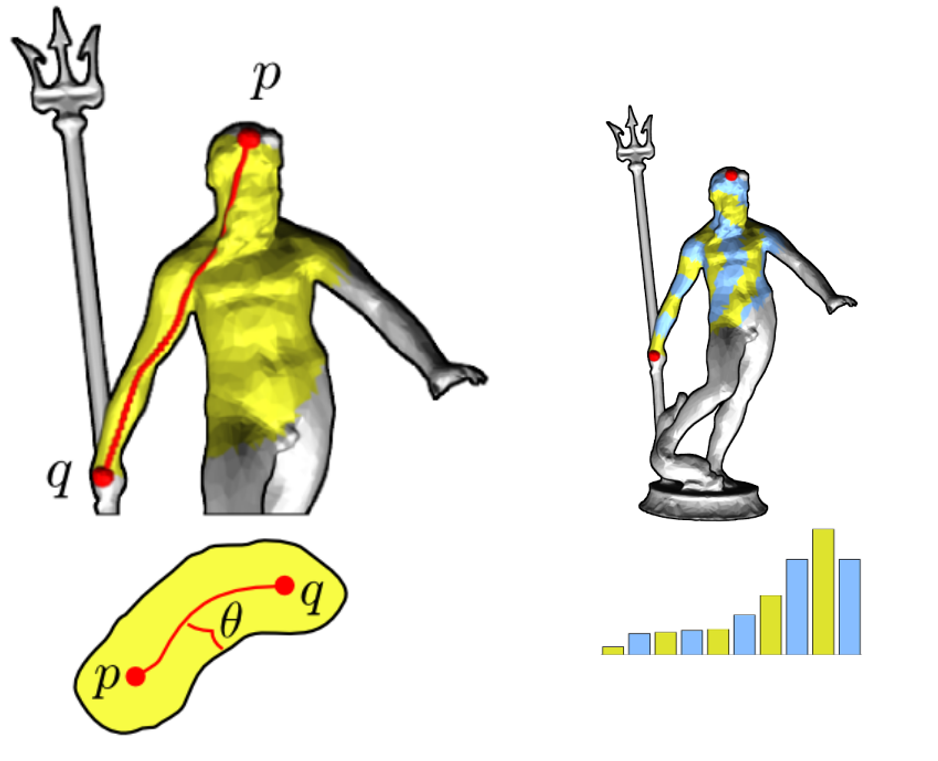
Figure-6: Bilateral map from vertex p to vertex q, its associated yellow region interest that is ${\theta}$ distance away from shortest path between p and q, and bilateral map signature [1]
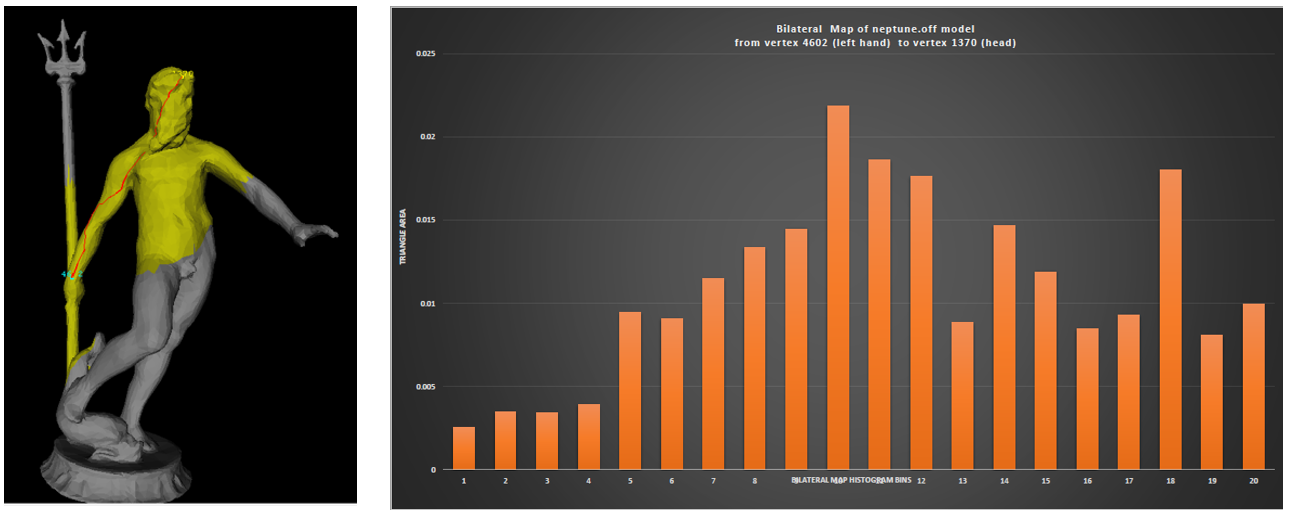
Figure-7: Bilateral map descriptor implementation results. Note that on the histogram X axis denotes index of histogram bins, Y axis denotes total triangle area in each bin
I have tried to summarize my first journey in digital gemoetry processing in this post, hope you have enjoyed it $\triangle$
References: